Introduction
Model-based Geostatistics for Global Public Health
Overview
- Defining geostatistical problems
- Model-based geostatistics as a data-driven approach to spatial analysis of health outcomes
Epidemiological Data
- Incidence: Number of new cases per unit time per unit population
- Prevalence: Number of existing cases per unit population
- Risk: Probability that a person will contract the disease (per unit time or lifetime)
Objective: Understand spatial variation in disease incidence, prevalence, and risk
Relevant books:
Elliott et al. (2000), Gelfand et al. (2010), Rothman (1986), Waller & Gotway (2004), Woodward (1999)
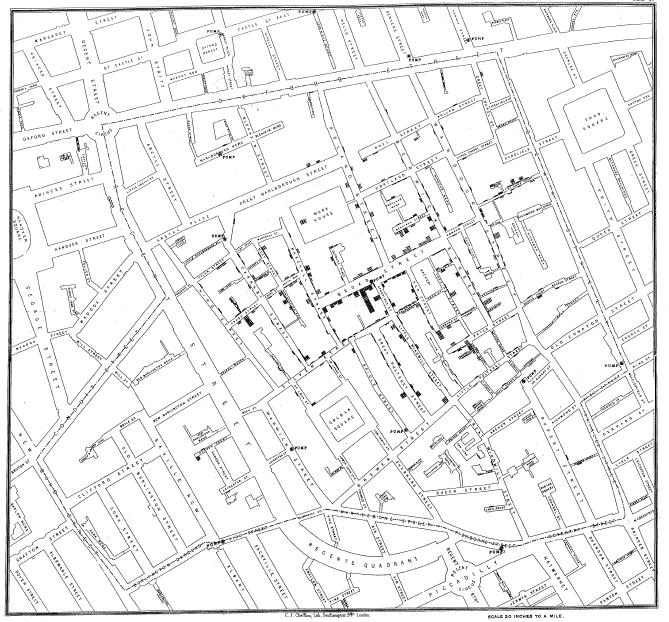
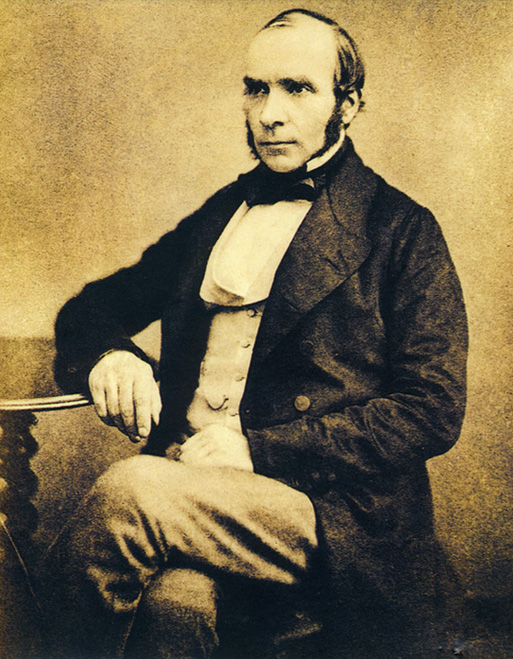
Cholera in Victorian London, 1854
- John Snow removed the handle of the Broad Street water pump
- Identified contaminated water as the disease source
- Contradicted conventional wisdom at the time
Study Designs
- Registry
- Case counts in sub-regions
- Population size as denominator
- Covariates from census data
- Case counts in sub-regions
- Case-Control
- Cases: All known cases in the study region
- Controls: Probability sample of non-cases
- Cases: All known cases in the study region
- Survey
- Sampled locations within study region
- Data collected per location
- Common in low-resource settings
- Sampled locations within study region
Registry Example: Plague in Madagascar
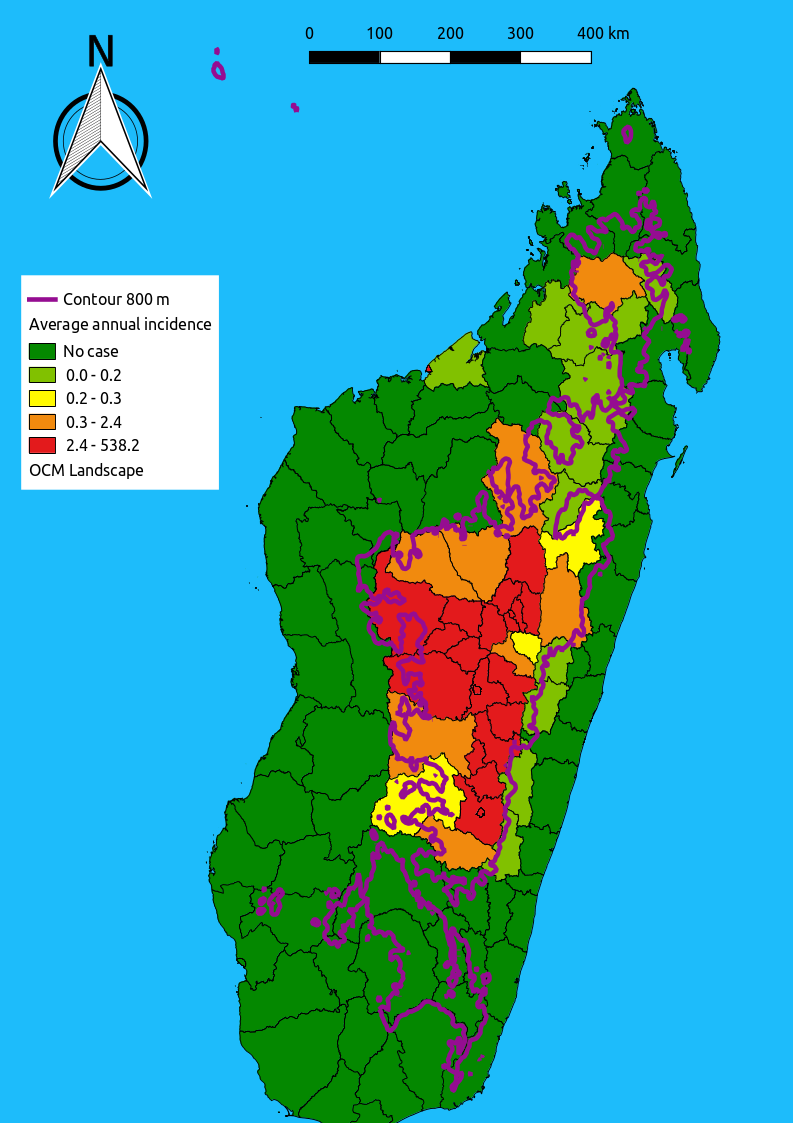
Research Question:
Does plague infection risk increase above 800m elevation?
Giorgi et al., 2016, Spatial and Spatio-temporal Epidemiology
Case-Control Example: Childhood Leukaemia in Humberside
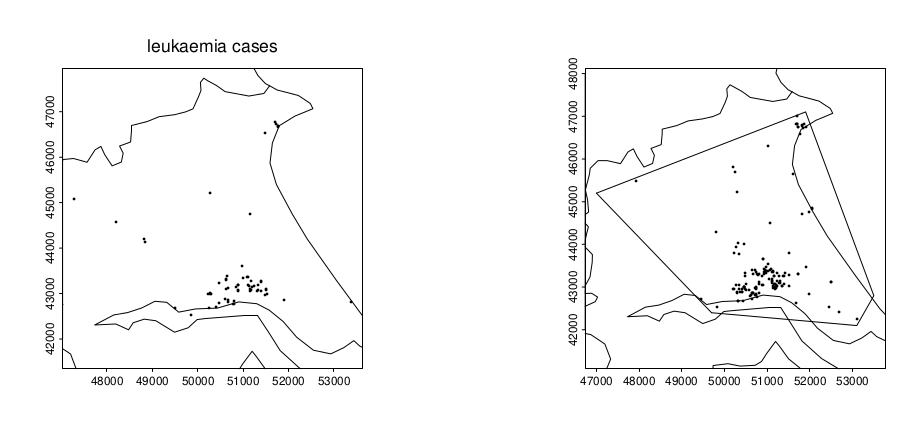
- Locations of all known cases (1974–82)
- Residential locations of a random sample of births
References:
Cuzick & Edwards (1990), Diggle & Chetwynd (1991)
Survey Example: Loa loa in Cameroon
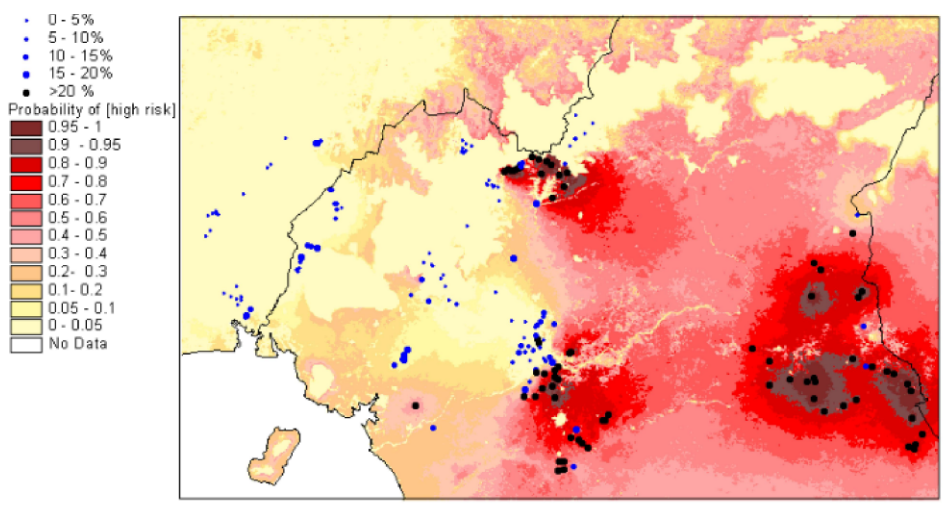
- Data: Empirical prevalences in surveyed villages
- Map: Predictive probabilities of exceeding 20% prevalence threshold
Research Questions
Plague in Madagascar
- Is elevation an important risk factor?
- If so, why?
Childhood Leukaemia in Humberside
- Do cases show unexpected clustering?
Loa loa in Cameroon
- What environmental factors influence risk?
- Can we predict areas exceeding an intervention threshold?
Epidemic vs Endemic Patterns
- Epidemic: Foot-and-mouth in Cumbria (2001)
- Endemic: Gastroenteric disease in Hampshire (AEGISS)
Animations:
- Foot-and-mouth
- AEGISS
How are these patterns different?
Empirical Modelling: AEGISS Project
- Objective: Early detection of incidence anomalies
- 3,374 reports of gastro-intestinal illness
- Log-Gaussian Cox process for space-time correlation

Geostatistics

Data: \((y_i, x_i)\), where \(x_i \in A \subset \mathbb{R}^2\)
Model: \(Y_i = S(x_i) + Z_i\)
Objective: Estimate \(\int_{A} S(x) dx\) (e.g., mining yield)
Model-Based Geostatistics for Public Health

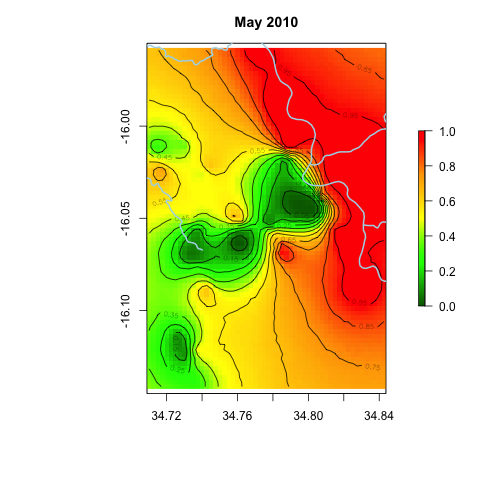
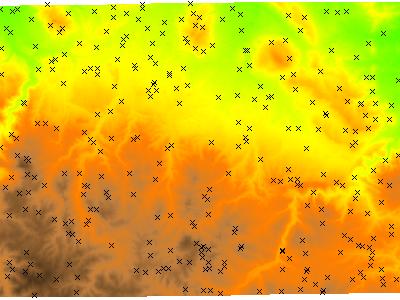
Animation: Malaria in Chikwawa district
Science and Statistics
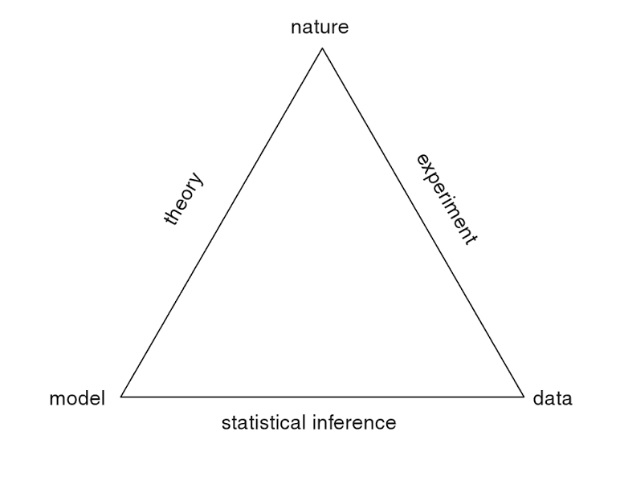
Key Concepts:
- \(S\): “Process of nature”
- \(Y\): “Observed data”
- Formulation of a statistical model: \([Y, S] = [S][Y | S]\)
Adapted from: Statistics and Scientific Method (Diggle & Chatwynd, 2011)
Workflow of a statistical analysis
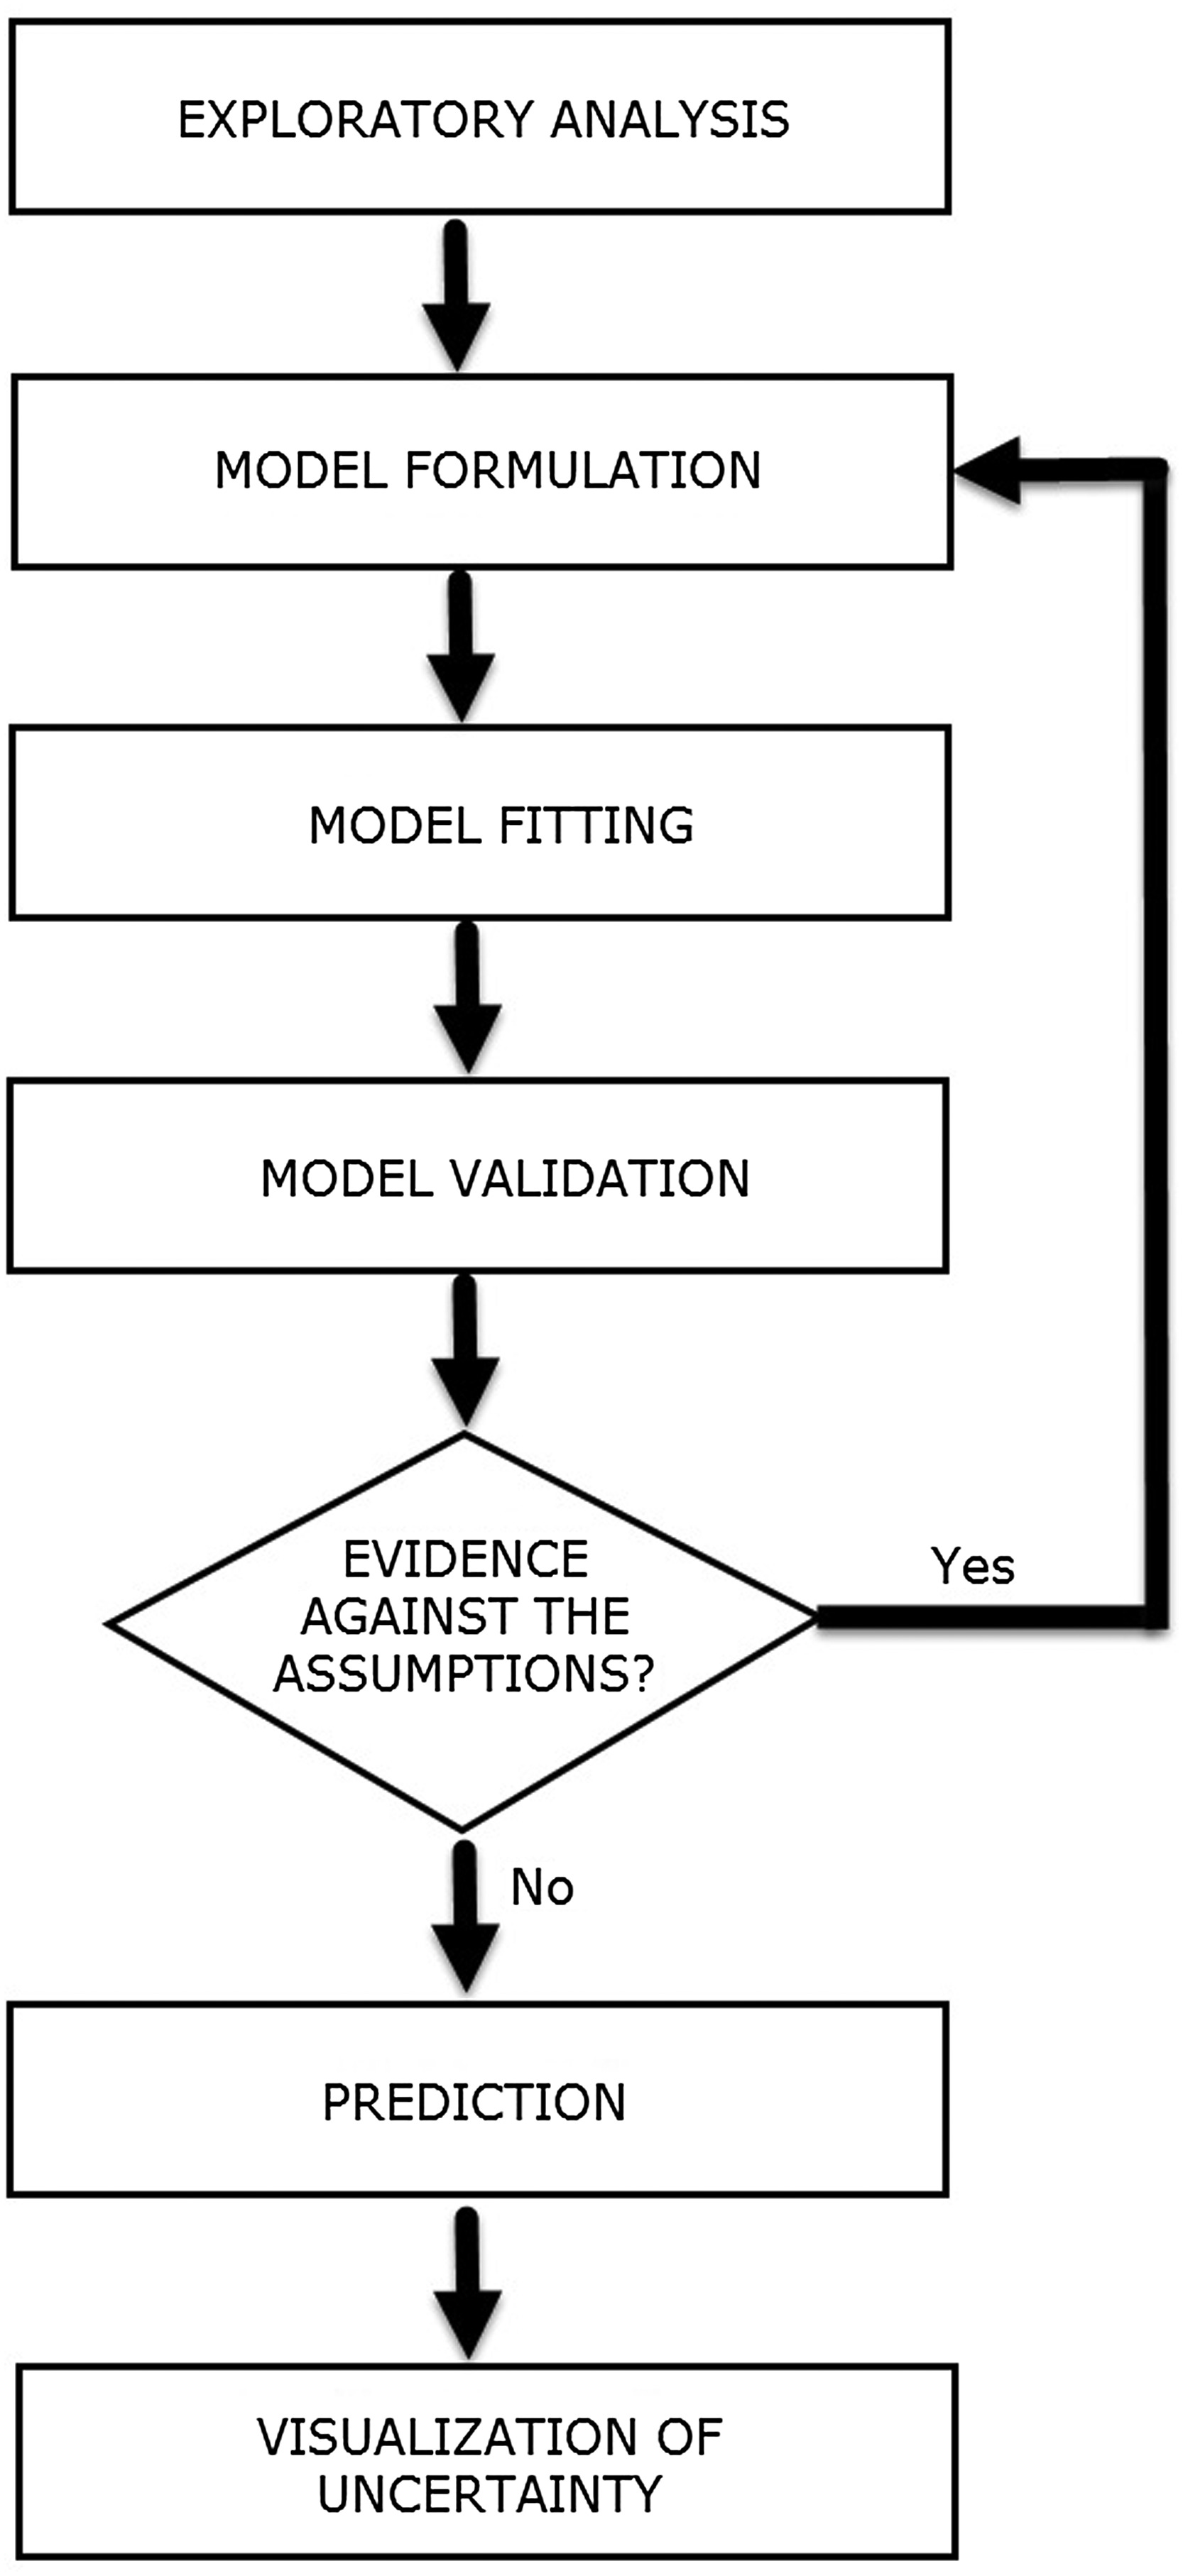
How do we apply the workflow of a statistical analysis in model-based geostatistics?